Wooly's Website
Harmonic Polarity:
A New View of Relationships Between Sounds
— A "Mathematical" Idea
Hi, I'm Wooly.
Unlike my previous article on tuning (Harmonics Major), this is a research report about a way to evaluate harmonic relationships in actual audio data. It is written more like an informal research notebook.
There is mathematics here, but the focus is on computation rather than on principles and axioms.
I am still organizing these ideas myself. I think this "harmonic polarity" might serve as a mathematical representation of some aspects of how people hear sound. However, the full picture, including its connections with music theory, is not yet clear. What I am offering here is one proposed method of calculation.
I decided to publish this in the hope that someone will find the method interesting, start computing with it, and use it in their own music research.
Even if the formulas are unfamiliar, I hope that anyone interested in harmonic relationships will read at least the opening sections. 🙇
The first part introduces "harmonic polarity" as a function with positive and negative values; the extension to complex numbers comes later. At the end of the page, I have also included links to web apps that calculate the functions introduced here. Please give them a try.
Perceiving Timbre (Harmonic Fusion)
The phenomenon in which multiple frequencies, especially those aligned in a harmonic series, are integrated and perceived as a single pitch at the fundamental frequency is apparently called harmonic fusion.
Even when a sound can be regarded as several sine waves at different pitches sounding together, we hear it at the pitch of the fundamental, while also perceiving differences that we describe as differences in "timbre."
I suspect that this relates not only to the mechanism of timbre, but also to musical phenomena more generally. Musical keys involve a tonic or a central note, and chord theory includes the idea of function. Since function changes with the key, it is a tonal concept. Could these ideas be connected with perceptual processes that integrate multiple frequencies, such as harmonic fusion?
So I began with this question: given a frequency spectrum, could we calculate something like "how much harmonic fusion is taking place" at each frequency, and obtain a spectrum representing the degree of harmonic fusion?
Try adding the harmonics of a sawtooth wave above C3. I think you will hear them merge into one sound, making the individual tones increasingly difficult to distinguish.
Volume ♫
Stopped
Fundamental: C3 (about 130.81 Hz). Each harmonic is a sine wave with relative amplitude 1/n. Harmonics 1–16 approximate a sawtooth wave.
Evaluating Harmonic Fusion (Harmonic Polarity)
Let be a real-valued intensity function of the frequency spectrum. I mainly use the squared magnitude of the Fourier transform of the audio waveform.
When modeling harmonic fusion, it seems natural to consider the following:
For a frequency , the presence of its harmonics makes a positive contribution at .
This seems a natural starting point.
But I also want to evaluate the inverse relationship:
For a frequency , the presence of its subharmonics makes a negative contribution at .
Whereas a harmonic has a frequency times , what is called a subharmonic has a frequency times . This is the inverse of the former relationship: frequency and its subharmonic satisfy
Thus, is the th harmonic of . When this relationship exists, my design gives a higher evaluation as a fundamental, and subtracts from the contribution associated with being a harmonic of .
More specifically:
Relative to , a value at contributes .
Relative to , a value at contributes .
This gives the following expression:
I call this "harmonic polarity." In theory, is also possible when the series converges; for computation, I use because the sum is truncated at a finite upper limit.
I chose the word "polarity" because this function assigns a positive or negative value to each frequency:
A larger positive value indicates a higher evaluation as a fundamental in harmonic fusion: a frequency that tends to incorporate other frequencies as its own harmonics.
A larger negative magnitude indicates the "harmonic side": a frequency that tends to be incorporated by other frequencies.
That is the interpretation. I picture an "attraction" between frequencies. It feels a little like a Coulomb's law of sound.
Higher harmonics usually attenuate in harmonic fusion. I therefore use weights such as or , mainly . A sawtooth wave is a representative waveform containing all harmonics, and its amplitudes decay as . So if uses squared magnitude, I think is an appropriate choice.
Also, because this sum starts at , does not include the spectrum's own value at frequency . It is a function that evaluates relationships with other frequencies alone.
I will also assign symbols to the sums on the harmonic and subharmonic sides, respectively:
The symbols H and S come from "harmonics" and "subharmonics."
With this notation, we can write
as the difference between the two sums.
Trying the Calculation
I obtained a MIDI file of Bach's C major Prelude from Mutopia and created an audio recording rendered with sine waves.
First, here is the spectrum of this recording:
Calculated in your browser as the graph approaches the viewport.
This is , chosen here as the squared magnitude of the audio's Fourier transform: the distribution of frequencies actually present in the sound. To calculate a spectrum for the whole recording, I average the STFT (short-time Fourier transform, a method for finding a spectrum at each moment) over the entire duration. Note that the frequency axis is logarithmic.
Calculating its harmonic polarity gives:
Calculated in your browser as the graph approaches the viewport.
The values now extend over a wider pitch range than the original spectrum. Can you see that there are more positive values on the left, in the low-frequency region, and more negative values on the right, in the middle and higher regions? This comes from the nature of the calculation of itself, and the same general tendency occurs with other recordings.
It is easier to see why by considering a single pure tone. If there is a value at frequency , then
hold. This happens at each harmonic order, producing the harmonic-polarity graph below.
Calculated in your browser as the graph approaches the viewport.
Positive values appear on the left and negative values on the right. In ordinary audio, these contributions overlap to produce graphs like the one above.
As mentioned earlier, does not include the value at frequency itself; it evaluates only harmonic relationships, namely the presence of harmonics and subharmonics. Consequently, as we have seen, its values extend into regions where no sound frequencies are actually present. It is a virtual evaluation of relationships alone. To evaluate harmonic fusion in a fuller sense, we should also include the strength of the fundamental itself. For example, define
and then use
with normalization to bring the scale into line with . Here I call this the "harmonic-fusion evaluation" function. For the recording above, its distribution is as follows.
Calculated in your browser as the graph approaches the viewport.
One point deserves attention: what I am doing here is somewhat unusual and differs from ordinary harmonic-fusion evaluation. Such evaluation is normally used, for example, to estimate the fundamental frequency of an instrument's sound.
Here, however, I apply it to a time-averaged frequency spectrum that represents an aggregation of the sounds used throughout a piece. I am examining which frequencies can be evaluated as fundamentals, and to what extent, when we consider harmonic-fusion relationships within that collection of sounds.
With that interpretation in mind, under the current analysis settings the largest value of in this piece appears at . In musical terms, this corresponds to G (near G1).
Octave Aggregation (Viewing Pitch Classes)
A musical key does not depend on pitch register. This way of treating sounds arises when we adopt octave equivalence, assigning the same note name to pitches an octave apart. To evaluate relationships in this direction, let us aggregate the spectrum across octaves.
For frequencies within one octave, we calculate the average, or simply the sum, of the values at all octave-related frequencies and arrange the results within that octave. Since an octave is a factor of two, the entire chain associated with a frequency is
k is any integer, including negative values
and we refer to the values at these frequencies for all integer k. I call the resulting distribution, with note names on the horizontal axis, a pitch-class distribution or pitch-class spectrum. Pitch classes need not be restricted to 12-tone equal temperament; the calculation can be performed continuously over an octave.
For the recording above, aggregating the frequency-spectrum values gives:
Calculated in your browser as the graph approaches the viewport.
I find it interesting that the characteristics of C major are already visible (C D E F G A B). The values are roughly proportional to how often each note is used in the piece. This suggests that C really does occur frequently here. However, simply using a piece's tonic frequently is not necessarily enough to determine its key. Another feature is that G is the most prominent after C, while A and B seem to be used less than the other notes of C major.
Now let us perform the octave aggregation for harmonic polarity . The result is:
Calculated in your browser as the graph approaches the viewport.
I think this is even more interesting to observe. First, the largest value has shifted to F. This is probably because F's third harmonic corresponds to C, so the many occurrences of C contribute to it. F major is also the subdominant of C major, which may have contributed as well.
Some pitch classes have positive values and others negative values. Averaging within ±50 cents of each note position in 12-tone equal temperament gives:
Calculated in your browser as the graph approaches the viewport.
Positive: C, F, A♯/B♭
Negative: C♯/D♭, D, D♯/E♭, E, F♯/G♭, G, G♯/A♭, A, B
As explained at the beginning, positive values indicate the degree to which a sound is on the fundamental side, drawing other sounds in as harmonics; negative values indicate the degree to which it is on the harmonic side, being drawn into other sounds. Because we are aggregating across octaves, however, this differs from the ordinary interpretation: it shows the average tendency across an octave family, or pitch class.
It is particularly easy to understand why E and G are on the negative side. C's third harmonic corresponds to G, and its fifth harmonic corresponds to E, although the latter is slightly displaced from its equal-tempered position.
And , the harmonic-fusion evaluation, looks like this:
Calculated in your browser as the graph approaches the viewport.
It may not look very different from alone, but F, which had a large positive harmonic-polarity value, has increased, while D and E have decreased. It is also interesting that G♯/A♭, A, A♯/B♭, and B have become nearly equal in value, making that region flatter.
Because this uses an average spectrum for the whole piece, relationships from multiple chords are mixed together. Of course, we can also calculate harmonic polarity from a spectrum at a particular moment, or averaged over a chosen interval, to examine the combination of sounds used during that time.
Instead of a musical recording, let us now examine the harmonic polarity of a simpler chord: C, E, and G at their equal-tempered positions, with equal amplitudes.
Calculated in your browser as the graph approaches the viewport.
Equal amplitudes may play a role here, but the main peaks are formed largely by the third-harmonic contributions. On the positive side, we find
C F A, an F major chord;
on the negative side, D G B, a G major chord.
This simply reflects the positions related to each of C, E, and G by a factor of three (×3 and ×1/3).
Let us add the spectral intensity and look at the harmonic-fusion evaluation.
Calculated in your browser as the graph approaches the viewport.
Although C, E, and G had equal amplitudes in the recording, the harmonic-fusion evaluation slightly reduces E and G, which lie on the harmonic side, making C the pitch class with the largest value. In this way, the harmonic-fusion evaluation function can, to some extent, evaluate which sounds lie on the fundamental side of harmonic relationships. The C major chord provides an easy-to-understand example.
The chord in this example had equal amplitudes, which for this case we can loosely think of as equal volumes. In actual music, though, chords are played with a variety of relative sound levels, and with amplitudes spread over multiple frequencies. I think it is these more general chords that are especially interesting to examine through harmonic polarity. We can calculate it for other chord types in 12-tone equal temperament, but there is no need to restrict ourselves to that tuning: any combination of frequencies can be used.
Vector Representation
(From here, I introduce an idea that goes a little beyond harmonic polarity.)
So far, we have looked at harmonic polarity , which evaluates harmonic and subharmonic components from onward with positive and negative contributions, and at the harmonic-fusion evaluation , which combines it with spectral intensity . Now I would like to discuss another interesting perspective on harmonic relationships.
Looking at the first few terms of the harmonic series,
these actually correspond to
| Ratio | ||||||
|---|---|---|---|---|---|---|
| Pitch class | do | do | sol | do | mi | sol |
or, in C major, C C G C E G.
Since an octave is a factor of two, the essential terms are
| Ratio | |||
|---|---|---|---|
| Pitch class | do | sol | mi |
the odd-numbered terms. In this way, the harmonic series seems connected with major tonality.
Now look at the subharmonic series. Interestingly,
correspond to
| Ratio | ||||||
|---|---|---|---|---|---|---|
| Pitch class | do | do | fa | do | la♭ | fa |
these notes. If we now reinterpret "" as do, we get
| Ratio | ||||||
|---|---|---|---|---|---|---|
| Pitch class | sol | sol | do | sol | mi♭ | do |
these notes: a minor chord. The familiar ratio 10:12:15 agrees with the portion , , , with as the root.
This suggests a connection between the subharmonic series and minor tonality.
Could harmonic polarity evaluate this? I considered several possibilities. The issue is the "1" in the series, the actual sound represented by . To include it in the harmonic series, using a positive sign as in harmonic-fusion evaluation makes sense. But to include it in the subharmonic series when considering a minor chord, we could give a negative sign and calculate . The negative component of harmonic polarity comes from the subharmonic series starting at n=2, so this places on that same side.
Let us actually calculate for a C minor chord:
Calculated in your browser as the graph approaches the viewport.
As expected, G has the largest negative magnitude, revealing the characteristics of the subharmonic series.
However, I thought it was somewhat cumbersome to change the sign of depending on whether I was examining major-type or minor-type relationships. So I tried designing
this complex number. I call it the "harmonic polarity vector." As a complex number, it is a kind of two-dimensional vector.
The advantage of this representation is that it contains both evaluations proposed above, obtained by changing the sign of . Its projections onto +45° and −45° are, respectively,
so they give quantities of the same kind. Looking at the complex number itself rather than its projections lets us examine whether a frequency leans toward harmonic-series fusion or toward belonging to a subharmonic series, including positions in between.
For C major:
Calculated in your browser as the graph approaches the viewport.
For C minor:
Calculated in your browser as the graph approaches the viewport.
For C major Prelude (Bach):
Calculated in your browser as the graph approaches the viewport.
There is, however, information that the harmonic polarity vector loses: cases where a frequency has both harmonic-series and subharmonic-series relationships. For example, in a chord containing F and G, F lies on C's × side and G on its ×3 side, so C has both relationships. In the harmonic polarity vector, this collapses onto the real axis and becomes mixed with the magnitude of , the amount of sound actually present.
That led me to the following expression:
Like three primary colors, this complex number places the actual spectral intensity , the harmonic-series relationship term , and the subharmonic-series relationship term along three equally spaced directions in the complex plane. Expanding it into real and imaginary parts gives
so it contains the same imaginary component as the harmonic polarity vector, multiplied by a constant! (Recall that .)
With placed at +120° and at −120°, strong contributions from both combine into a vector pointing near ±180°. If the real-axis contribution is also strong, cancellation moves the result closer to the origin.
I call this the "harmonic characteristic vector." I am still experimenting with the idea that this complex value could express a sound's character in terms of harmonic relationships.
For C major:
Calculated in your browser as the graph approaches the viewport.
For C minor:
Calculated in your browser as the graph approaches the viewport.
For C major Prelude (Bach):
Calculated in your browser as the graph approaches the viewport.
Afterword
I will end this article here. How was it? There is still much I would like to discuss about the harmonic characteristic vector, including
and other properties. But research and discoveries are still ongoing, and I have not yet assembled enough material to explain its properties systematically. The explanation of harmonic polarity alone has also made this a fairly long page, so I decided to leave those topics out this time.
I think harmonic polarity itself was a new concept, so I hope it offered a fresh perspective. Calculations of harmonic fusion are not in themselves new: they appear in several papers and software implementations, although methods incorporating subharmonics seem less common.
In particular, might "the idea that subharmonics are, in a sense, the inverse of the harmonic series" be useful beyond the harmonic-polarity calculation presented here?
This also means that we can regard the subharmonic series as "a sequence of frequencies whose nth harmonic is a fixed frequency."
"The subharmonic series does not physically exist, so the theory cannot hold."
This concept is often met with that response. Yet the relationship between harmonics and chord consonance also holds for sine waves, or pure tones, which contain no overtones.
I find it a little unfortunate that the view of harmonics and subharmonics as numerical "relationships" between frequencies does not seem to be widely recognized. I hope this article encourages some readers to adopt that perspective.
Even if the calculations were difficult to follow, I hope you can take at least this idea away with you.
Even just looking at the graphs, I hope you can see what is interesting about the harmonic characteristic vector, although I have only briefly introduced its formula here. In the C major Prelude graph above, the phase angle varies considerably from note to note. I think this may visualize differences in the harmonic roles of those notes.
Still, this article has only shown simple examples using a few recordings. I have therefore made web apps so that you can carry out experiments and observations yourself.
For a simpler app, try:
Fundamental Perception Simulator
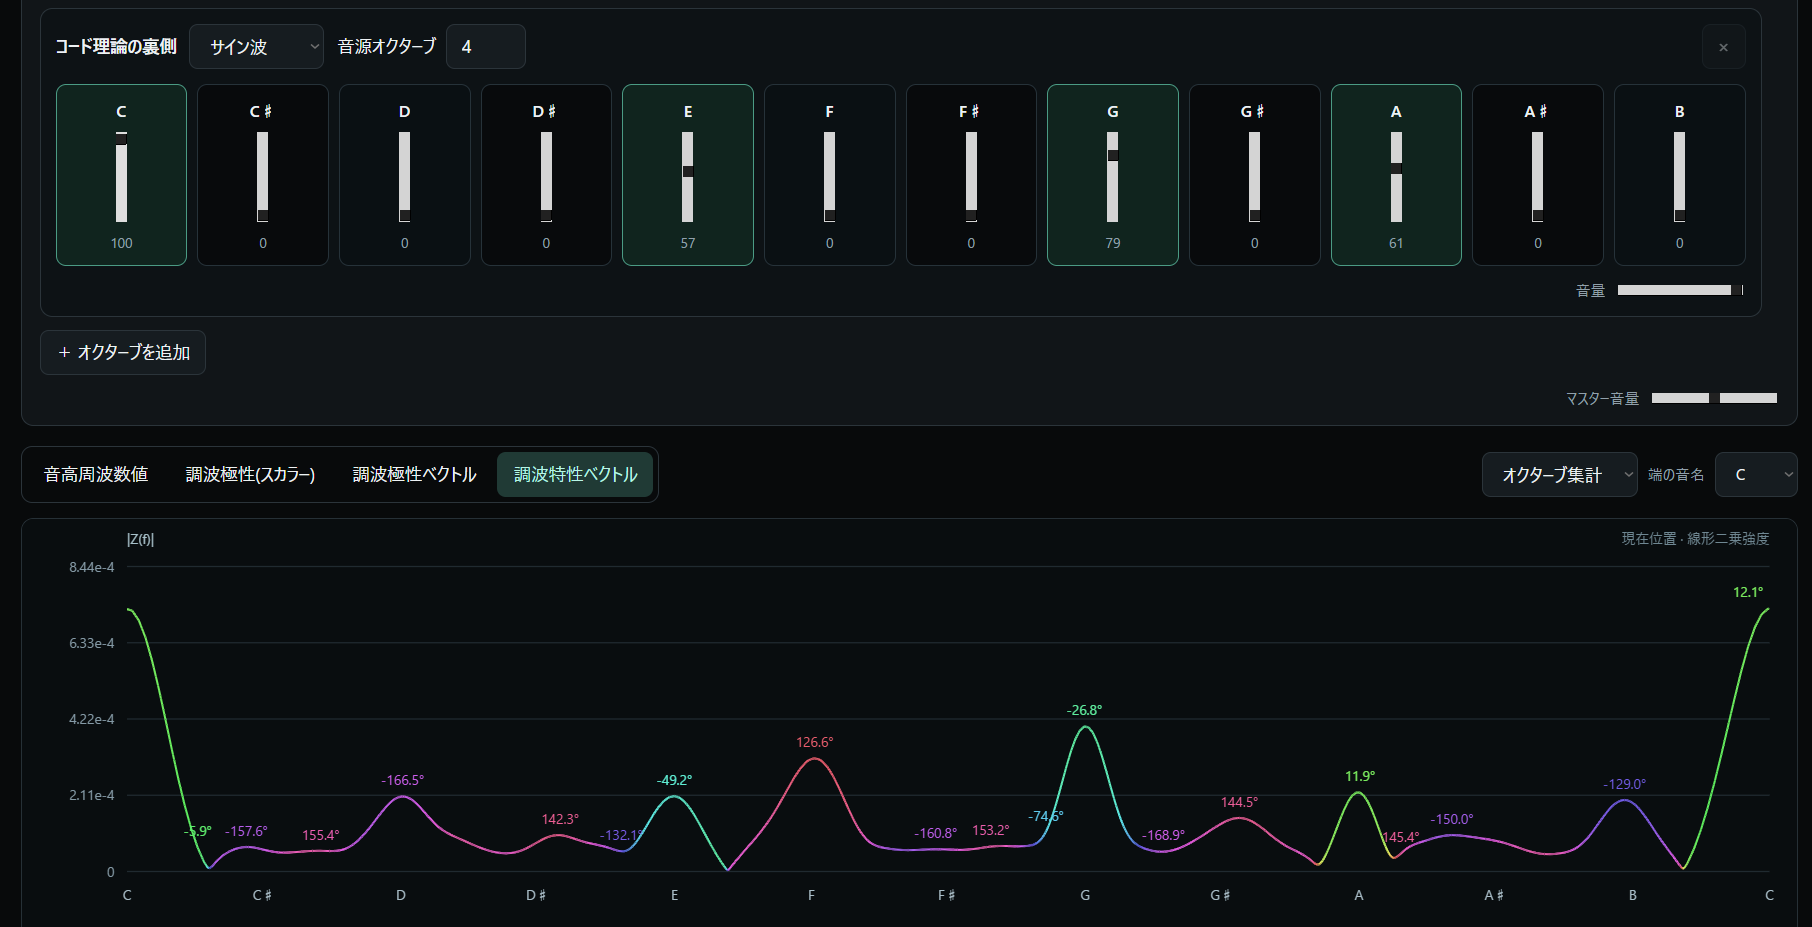
It can plot the functions introduced in this article from an audio file or microphone input. In its "Behind Chord Theory" section, you can also create chords by adjusting volume sliders for notes in 12-tone equal temperament, then view graphs of their harmonic relationships.
For more detailed parameter controls and graph export, try:
TONAL / WAVE WEB
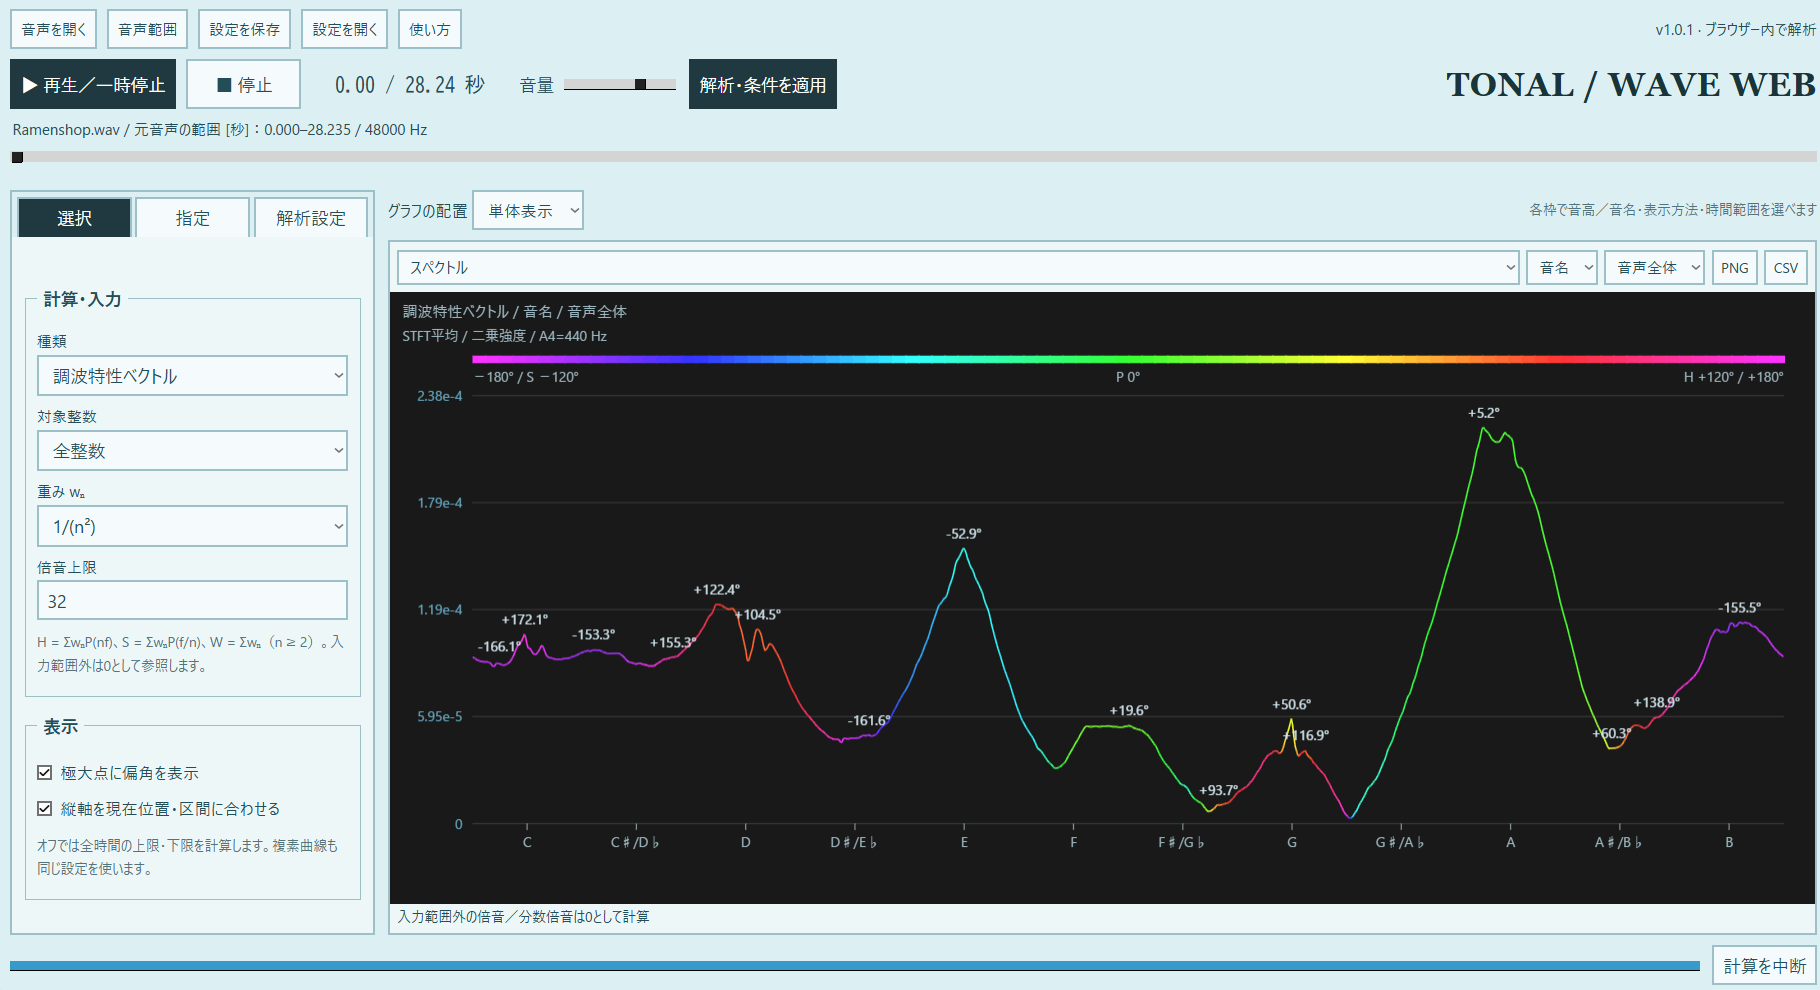
This app loads audio files and calculates graphs from the harmonic-polarity family of functions. It supports PNG and CSV export. It also offers several display modes: for example, you can select a pitch or pitch class and display its harmonic-relationship values over time, or draw curves of pitch or pitch-class values in the corresponding complex plane. Other features include continuous analysis of harmonic relationships using spectra averaged over musical time intervals, such as quarter notes matched to a piece's tempo.
Please try calculating harmonic polarity for your favorite chords, pieces, or your own music, and see what you discover.
My aim is to build a theory of sound that can represent the space of sounds as people experience it, much as color science represents color space. This is still far from a practical framework, but I intend to keep researching it. If you are interested, please visit my X account or this website again.
Thank you for reading. This was Wooly.